C. Goetz (Wien, AT)
ImageBiopsy LabPresenter Of 2 Presentations
16.3.8 - A novel quantitative metric for joint space width: data from the Osteoarthritis Initiative
Abstract
Purpose
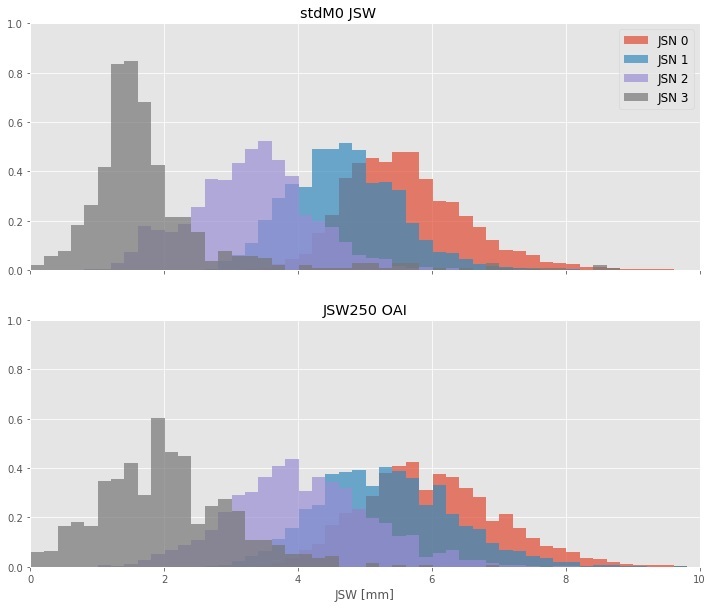
Joint Space Width (JSW) has been the gold standard to assess loss of cartilage in knee OA. Here we describe a novel quantitative measure of joint space width, standardized JSW (stdJSW). We assess the performance of this quantitative metric for joint space widthat tracking Joint Space Narrowing OARSI grade (JSN) changes and provide reference values for different joint space narrowing OARSI grades and their annual change.
Methods and Materials
We collected 18.934 individual knee images from the OAI study, from the follow-up visits up to month 48 (baseline plus 4 follow-up exams). Absolute JSW measurements and JSN readings were collected from the OAI study. Standardized JSW and 12-month changes were calculated for each knee. For each JSN grade and 12-month grade change, the distribution of JSW loss was calculated both for standardized JSW as well as absolute JSW measurements retrieved from the OAI study. Area under the curve of the ROC curves was calculated for the performance of both absolute and standardized JSW at discriminating between different JSN grades. Standardized response mean (SRM) was used to compare the responsiveness of the two measures to change in JSN grade.
Results
The areas under the ROC curve for stdJSW at discriminating between successive JSN grades were AUCstdJSW= 0.87, 0.95, and 0.96, for JSN>0, JSN>1 and JSN>2, respectively, whereas these were AUCfJSW= 0.79, 0.90, 0.98 for absolute JSW. We find that standardized JSW is significantly more responsive than absolute JSW, as measured by the Standardized Response Mean. Furthermore, we present reference values for standardized JSW stratified by base JSN grade and 12-month JSN change.

Conclusion
Our results show that standardized JSW is a better choice to track changes in JSN and to discriminate between JSN grades. Furthermore, our results show that standardized JSW cancels part of the normal variation in JSWs that comes from height variation.
23.2.6 - Automated detection of Bone Marrow Edemas from MRI: data from the Osteoarthritis Initiative
Abstract
Purpose
Bone marrow edemas (BMEs) are defined as localized build-up of fluids within the bone marrow, often leading to swelling, which are strongly associated with pain and progression of joint deterioration. However, manual reading of BMEs is a time-consuming task for the physician. Here, we ask if a deep neural network can automatically detect the presence or absence of BME from T2 sequences of Magnetic Resonance images.
Methods and Materials
We collected 24.885 MRI sequences from the OAI study with associated labels of 10.429 for BMEs in the form of MOAKS scores. Sequences were classified for the presence of BMEs if the total number of BMEs exceeded 1 and its reported size of less than 33% in the respective compartment. This dataset was split into training/testing datasets of sizes 773 and 465, respectively. A deep neural network was trained on 1083 training/validation splits of the training dataset. Training performance was assessed by classification accuracy and testing performance was assessed by the area under the ROC curve (AUC).
Results
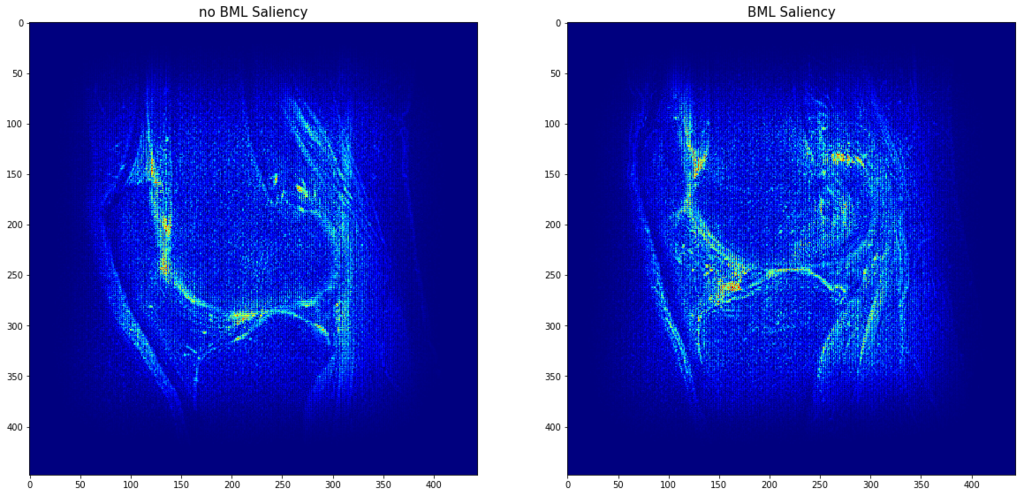
The final training accuracy on the training/validation datasets was 1 and 0.81. We find that our deep neural network achieves an AUC of 0.90 on the testing dataset at the detection of BMEs from T2 MRI sequences. Furthermore, saliency analysis reveals the location of these BMEs.

Conclusion
Our results show that our method performs excellently at detecting BMEs from MRI. This automated method assesses a full MRI sequence under 2 seconds and, combined with automatic highlighting of the detected BMEs, can substantially decrease physicians’ time spent on this routine task.


